


 Hide All
Use nested grouping and subtotals in the Matrix data region, to replicate a drilldown report. This walkthrough illustrates a step by step overview of a Matrix report through a simple example.
The walkthrough is split into the following activities:
- Adding an ActiveReport to a Visual Studio project
- Connecting the report to a data source
- Adding a dataset with calculated fields
- Creating a layout for the report
- Adding nested grouping and drill-down to the matrix
- Adding subtotals to the matrix
- Enhancing the appearance of the report
- Viewing the report
 |
Note: This walkthrough uses the Sale table from the Reels database. By default, in ActiveReports Developer, the Reels.mdb file is located in the [User Documents folder]\ComponentOne Samples\ActiveReports Developer 7\Data folder. |
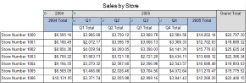
When you complete this walkthrough you get a layout looks similar to the following at design time and at runtime.
Design Time Layout


Runtime Layout
 To add an ActiveReport to the Visual Studio project
- Create a new Visual Studio project.
- From the Project menu, select Add New Item.
- In the Add New Item dialog that appears, select ActiveReports 7 Page Report and in the Name field, rename the file as rptMatrix.
- Click the Add button to open a new fixed page report in the designer.
See Adding an ActiveReport to a Project for information on adding different report layouts.
To connect the report to a data source
- In the Report Explorer, right-click the Data Sources node and select the Add Data Source option or select Data Source from the Add button.
- In the Report Data Source Dialog that appears, select the General page and in the Name field, enter a name like ReportData.
- On this page, create a connection to the Reels database. See Connect to a Data Source for information on connecting to a data source.
- In the Report Explorer, right-click the data source node and select the Add Data Set option or select Data Set from the Add button.
- In the DataSet Dialog that appears, select the General page and enter the name of the dataset as Sale. This name appears as a child node to the data source icon in the Report Explorer.
- On the Query page of this dialog, in the Query field enter the following SQL query.
SQL Query  Copy Code
SELECT Store, SaleDate, SalesAmount FROM Sale ORDER BY Store, SaleDate
- Click the Validate DataSet icon at the top right hand corner above the Query box to validate the query.

- On the Fields page of this dialog, enter three new calculated fields with the values in the following table.
Field Name Value Month =Fields!SaleDate.Value.Month Quarter =Choose(1 + ((Fields!Month.Value - 1)\3), "Q1", "Q2", "Q3", "Q4") Year =Fields!SaleDate.Value.Year - Click OK to close the dialog. Your data set and queried fields appear as nodes in the Report Explorer.
To create a layout for the report
- Click the gray area below the design surface to select the report, go to the Properties Window, expand the PageSize property and set the Width to 10in and Height 11in.
- From the toolbox, drag a Matrix data region onto the body of the report in the top left corner. The matrix initially has four textbox cells.
Property Name Property Value Location 0in, 0.5in Size 3in, 1in FixedSize (only for FPL reports) 8in, 7in - In the Report Explorer from the Sale dataset, drag the Store field into the bottom left cell in the matrix. This is the row header, and dragging a field into it automatically adds a Row Group which groups data by store in rows down the page at run time.
- Go to the Properties Window to set the Value property to ="Store #" & Fields!Store.Value. This concatenates a string with the field value and makes the Store value more user-friendly at run time.
- In the Report Explorer from the Sale dataset, drag the Year field into the top right cell in the matrix. This is the column header, and automatically groups data in columns to the right at runtime.
- With the Year cell selected, go to the Properties window to set the TextAlign property to Center.
- In the Report Explorer from the Sale dataset, drag the SalesAmount field into the bottom right cell in the matrix. This is the detail data cell, and displays aggregated data for the intersection of each column and row at run time.
- With the SalesAmount cell selected, in the Properties window set the Format property to Currency and the Value property to =Sum(Fields!SalesAmount.Value).
To add nested grouping and drilldown features to the matrix
- In the Report Explorer from the Sale dataset, drag the Quarter field to the top right Year cell and move the cursor down slightly so that the bar appears at the bottom edge of the cell before dropping it.
This adds a cell below the Year cell and automatically adds a Quarter grouping to the Column Groups for the matrix.
- With the new Quarter cell selected, go to the Properties window to set the TextAlign property to Center.
- Select the Matrix data region and under the Properties Window select Property dialog command to open the Matrix dialog. See Properties Window for details on commands.
- On the Column Groups page, select the Matrix1_Quarter group and go to the Visibility tab.
- Under Visibility, change the Initial visibility to Hidden and select the check box next to Visibility can be toggled by another report item.

Tip: In order to provide drill-down functionality, we must set visibility on the group we want to hide. - In the drop down enabled below, enter TextBox3 (Textbox containing Year values in the Matrix) and click OK to close the dialog.
This enables users to click the plus sign next to the Year to view the quarterly details at runtime. - In the Report Explorer from the Sale dataset, drag the Month field to the Quarter cell and move the cursor down slightly so that the bar appears at the bottom edge of the cell before dropping it.
This adds a cell below the Year cell and automatically adds a Month grouping to the Column Groups for the matrix.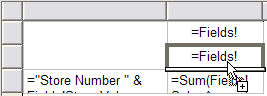
- Select the Matrix data region and under the Properties Window select Property dialog command to open the Matrix dialog.
- On the Column Groups page, select the Matrix1_Month group and go to the Visibility tab.
- Under Visibility, change the Initial visibility to Hidden and select the check box next to Visibility can be toggled by another report item.
- In the drop down enabled below, enter TextBox5 (Textbox containing Quarter values in the Matrix) and click OK to close the dialog.
This enables users to click the plus sign next to the quarter to view the monthly details at runtime. - Click OK to close the dialog.
To add subtotals to the matrix
Without subtotals, viewing the report at run time shows data for each year, or if expanded, for each quarter or month. Adding subtotals displays totals for each group in a new column to the right of the group.
- Right-click the Year cell and select Subtotal. A new column appears to the right with the text Total and a green mark at the top right corner (Clicking the green mark displays the MatrixSubtotal properties in the Properties Window).
- Select the new Total cell and go the Properties Window to set the following properties:
Property Name Property Value TextAlign Center Value Grand Total - Right-click the Quarter cell and select Subtotal.
- Select the new Total cell and go to the Properties Window to set the following properties:
Property Name Property Value TextAlign Center Value =Fields!Year.Value & " Total" - Right-click the Month cell and select Subtotal.
- Select the new Total cell and go to the Properties Window to set the following properties:
Property Name Property Value TextAlign Center Value =Fields!Quarter.Value & " Total"
To enhance the appearance of the report
If you preview the report at this point, you notice that although all of the data displays correctly, it is difficult to identify data when you start drilling down into it. This can be improved with background colors and borders.
- In the matrix data region of your report, select the textbox that contains the month field and go to the Properties Window to set the following properties:
Property Name Property Value Format MMMM Value =Fields!SaleDate.Value Note: Changing the textbox value does not affect the grouping value, so the data is still grouped by month. - Holding down the Shift key, select the two textboxes in the top row containing the Year and Grand Total cells and make the following changes in the Properties window:
Property Name Property Value BackgroundColor Gainsboro BorderStyle Solid - Holding down the Shift key, select the two textboxes in the second row containing the expressions =Fields!Quarter.Value and =Fields!Year.Value & " Total" and make the following changes in the Properties Window:
Property Name Property Value BackgroundColor LightSteelBlue BorderStyle Solid - Holding down the Shift key, select the two textboxes in the third row containing the month and quarterly total cells and make the following changes in the Properties Window:
Property Name Property Value BackgroundColor AliceBlue BorderStyle Solid - Holding down the Shift key, select the two textboxes in the fourth row containing the store number and detail cells and make the following change in the Properties Window:
Property Name Property Value BorderStyle Solid - From the toolbox, drag a Textbox control onto the design surface to span the entire width of the report.
Tip: In a CPL report, you can place the Textbox in the PageHeader. - Go to the Properties window to set the following properties.
Property Name Property Value Location 0in, 0.25in Size 6.5in, 0.25in TextAlign Center FontSize 14pt Value Sales by Store
- Click the preview tab to view the report at design time.
OR
- Open the report in the Viewer. See Using the Viewer for further information.